Whether you’re considering launching a new venture, introducing a product, or expanding your current offerings, the excitement of possibility comes hand in hand with financial uncertainty. This is where a break-even analysis becomes an invaluable tool in your business development toolkit. A break-even analysis reveals that critical point you’ll need to exceed, either in revenue or units sold, for your endeavor to become profitable. That way you can know where you’re headed before you invest your money and time.
A break-even analysis provides insight to help set sales prices, make cost adjustments, and other considerations. It can help you gauge cash flow needs, whether you need to borrow money to keep your business afloat until you’re pocketing profits, or whether the endeavor is worth pursuing at all.
What Is Break-Even Analysis?
A break-even analysis is a financial calculation that determines the point at which the total costs of a new business, service, or product exactly equal its total revenue. At that point, you will have neither lost money nor made a profit. Rather, it reveals the point, either in terms of total sales dollars or unit volume, at which you have covered all of your costs. A break-even analysis is a critical tool for making decisions about pricing, production volumes, costs, and the overall viability of products or services.
Key Takeaways
- A break-even analysis reveals the unit sales volume where revenue and costs are at equilibrium.
- The analysis shows the interaction of selling price, variable costs, and fixed costs, so a business knows how many units it must sell to cover its fixed costs under different scenarios. .
- In general, higher sales prices, lower variable costs, and lower fixed costs lead to a lower break-even point.
- A business will want to use a break-even analysis anytime it considers adding costs, such as making a big fixed-cost investment or using better materials that increase unit costs.
How Break-Even Analysis Works
A break-even analysis is a financial calculation used to determine a company’s break-even point (BEP). It is an internal management tool used for budgeting and capital allocations that is not typically shared in a company’s financial statements. However, venture capitalists, potential partners, and lending institutions may ask for it as part of your financial projections before committing funds or approving a loan.
The formula takes into account both fixed and variable costs relative to unit sales price and profit. Fixed costs are those that remain the same no matter how much product or service is produced or sold. Examples of fixed costs include facility rent or mortgage, equipment costs, salaries, interest paid on capital, property taxes, and insurance premiums.
Variable costs rise and fall according to changes in how much a company makes or sells. Examples of variable costs include direct hourly labor costs, sales commissions, and costs for raw materials, utilities, and shipping. For a manufactured product, the majority of variable costs typically consist of the labor and material costs it takes to produce one unit of your product, but it may also include other costs that vary with volume, such as royalties or transaction fees.
Total variable cost is calculated by multiplying the cost to produce one unit by the number of units you produced. For example, if it costs $10 to produce one unit and you made 30, then the total variable cost would be $300 ($10 x 30).
What Is Contribution Margin?
The contribution margin (CM) is the difference between a product’s sales price and its total variable cost. It represents the amount of revenue available to pay fixed costs after covering all of the variable costs. It can be calculated at a high level, using the total revenue and total variable expenses, or on a per unit basis. For example, if a suitcase sells at $125 and its variable cost is $15, then the unit contribution margin is $110 ($125 – $15). This means that for every suitcase sold, $110 is first used to offset fixed costs; any remaining money is profit.
Unit contribution margin = Unit sales price – Unit variable costs
The average variable cost is calculated as total variable cost divided by the number of units produced.
In general, lower variable costs lead to a higher contribution margin and a lower break-even point.
Why Is Contribution Margin Important in a Break-Even Analysis?
Contribution margin is a fundamental part of break-even analysis because it is the measure that directly determines the number of units a company must sell to cover all of its costs. CM represents the portion of each sale available to cover fixed costs and ultimately generate a profit, which is the true goal of most enterprises. Businesses use CM to quickly calculate their BEPs and project how changes in sales price, costs, sales volume, and product mix impact profitability. A higher contribution margin lowers the break-even threshold, allowing a company to achieve profitability more quickly.
In addition, CM analysis helps identify which products or services are most profitable, guiding resource allocation and strategic planning.
Why Does Your Business Need to Perform Break-Even Analysis?
A break-even analysis is a critical element of financial projections for startups and of established businesses considering investing in new or expanded product lines. For startups, it can be used to determine how much seed money or startup capital you’ll need and whether you’ll need a bank loan. Mature businesses use break-even analyses to evaluate their risks in a variety of activities, such as moving innovative ideas to production or adding or deleting products from their offerings. Another example is in budgeting the addition of a new employee. A break-even analysis will reveal how many additional sales it will take to break even on expenses associated with the new hire.
Benefits of Break-Even Analysis
Break-even analysis is a key element of cost-volume-profit (CVP) analysis, which evaluates how hypothetical changes in activity levels could influence revenue and costs. This makes it a valuable tool for managing and expanding a business. Specifically, break-even analysis supports:
- Decision-making: When considering a new product launch, investment, or process change, understanding the impact on the break-even point can help determine whether these actions are practical or achievable in the contexts of production capacity and market demand.
- Revenue targeting: The BEP and CM help a company establish targets for revenue, pricing, and sales , so that goals are set at levels that drive profitability.
- Cost management: Categorizing costs into fixed and variable components offers valuable insights into the company’s cost structure, including identifying opportunities to reduce or optimize expenses. This process also helps managers set cost targets by working backward from desired profitability and a realistic BEP.
- Risk management: Modeling “what-if” scenarios using break-even analysis helps company see potential results of a range of scenarios before investing their resources.
What Is a Standard Break-Even Time Period?
There is no one-size-fits all break-even time period, although a window of six to 18 months is common in many industries. But many factors come into play, such as where funding for the venture is coming from—banks, private equity, venture capitalists, or the business owners themselves. Industry is another significant factor, with sectors such as technology and pharmaceuticals typically needing more time to break even due to high initial research and development costs. Similarly, a company’s business model can influence this timeline. For example, companies that offer subscription-based services may take longer to break even because of high customer acquisition costs and a longer revenue cycle than a business that gets paid upfront. The scale of investment also matters; larger projects with substantial upfront investments are often built with the expectation they’ll require more time to reach profitability. Finally, market conditions—such as the macroeconomic environment and competition—can significantly impact expectations around break-even timing.
Who Performs a Break-Even Analysis?
Break-even analysis is used in companies of all sizes and industries. They follow the same approach but may have slightly nuanced objectives, depending on their circumstances. Some key users and their typical applications include:
- Business owners: Business owners use break-even analyses to understand their companies’ financial health, set sales and cost targets, make pricing decisions, evaluate new products or services, and plan for profitability. It’s a crucial tool for ongoing operations and strategic planning.
- Entrepreneurs: When starting a new business or launching new products, a break-even analysis is essential for determining the viability of an idea, setting realistic goals, and securing funding. It is often a key component of business plans and pitch decks.
- Financial analysts: Internal financial analysts are primary users of a break-even analysis, assessing the profitability and financial feasibility of projects, products, and investments. They often leverage this tool for scenario analyses and to project performance.
- Governments: Public-sector agencies use break-even analyses to evaluate government projects and assess the impact of policy changes. Examples include setting utility rates, evaluating infrastructure projects, and negotiating funding for public-private collaborations.
- Investors: Investment professionals use break-even analyses to manage their financial investments and determine the market price needed to recoup the amount paid for an investment, especially when there are fees associated with the purchase and sale transactions.
When to Use a Break-Even Analysis
A business will want to use a break-even analysis anytime it considers adding costs. These additional costs could come from starting a business, making an acquisition, adding or changing products, launching a major advertising campaign, or adding locations or employees.
In other words, you should use a break-even analysis to determine the risk and value of any business investment, especially when one of these three events occurs:
1. Expanding a Business
A break-even analysis will help business owners/CFOs get a reality check on how long it will take an investment to become profitable—for example, calculating or modeling the minimum sales required to cover the costs of a new location or entering a new market. It is also instructive for capacity and resource planning to ascertain whether additional infrastructure is needed to reach and exceed break-even volumes.
2. Lowering Prices
Sometime businesses need to lower prices to compete in a specific market segment or product. While this doesn’t add cost, it does reduce the unit contribution margin. So when lowering pricing, businesses need to figure out how many more units they’ll need to sell to make up for a price decrease and still cover fixed costs.
3. Narrowing Down Business Scenarios
When making changes to the business, too many scenarios and what-ifs can complicate decision-making. A break-even analysis and the resulting BEP is a quantitative measure that helps business leaders make objective decisions when evaluating options and risks.
How Do You Calculate the Break-Even Point?
ERP and accounting software with managerial accounting features will typically calculate your BEP for you, but you may want to understand what goes into that equation.
Break-Even Analysis Formula
Break-even quantity = Fixed costs / (Sales price per unit – Variable cost per unit)
You can also use our break-even analysis template(opens in a new tab).
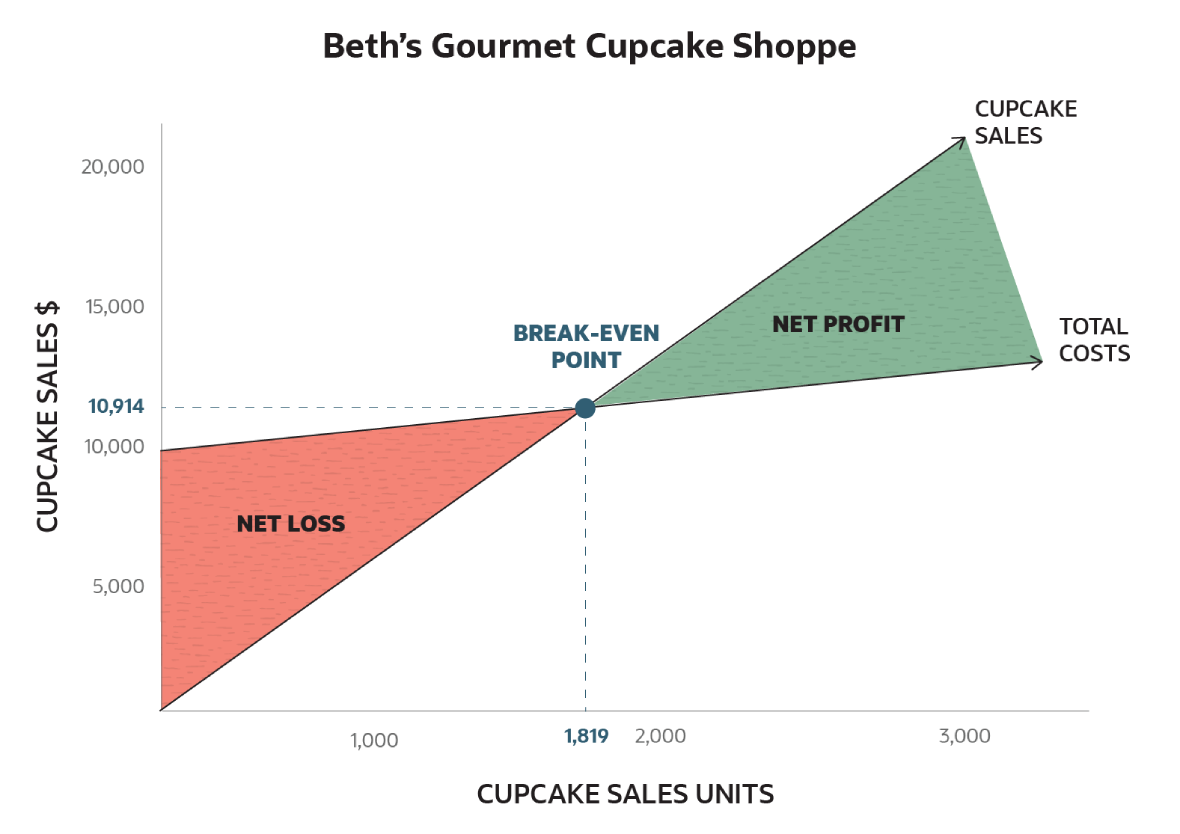
Break-Even Analysis Example
Beth has dreams of opening a gourmet cupcake store. She does a break-even analysis to determine how many cupcakes she’ll have to sell to break even. She did the preliminary math, so she knows her fixed costs for one year are $10,000 and her variable cost per unit is $.50. She also did a competitor study and some other calculations and determined her unit price to be $6.00.
$10,000 / ($6 – $0.50) = 1,819 cupcakes that Beth must sell in one year to break even
The Limitations of a Break-Even Analysis
The most important thing to remember is that a break-even analysis does not consider market demand. Knowing that you need to sell 1,819 cupcakes, as in the above example, to break even does not tell you if or when you can sell them. Don’t let your passion for your business idea or new product cause you to lose sight of that basic truth.
On the flip side, you’ll need to decide how much effort and time you’re willing to expend to reach the BEP. For example, are you willing to invest a substantial percentage of your sales team’s time and effort over several months to reach the BEP? Or is producing and selling something else a better and more profitable use of time and effort?
If you find demand for the product is soft, you may have to lower prices to move it faster. However, discounted pricing raises your BEP. If you’re not careful, you might move more products faster at the lower price but not be able to sell enough additional units to reach your higher BEP.
How to Lower Your Break-Even Point
In order to lower your break-even point, you need to raise your contribution margin or lower your fixed costs. There are two ways to achieve a higher contribution margin.
- First, you can raise the sales price, either directly on the price tag or indirectly by offering smaller or fewer discounts.
- Second, lower your variable costs. There are many ways to approach this, such as using cheaper raw materials, reducing labor costs through automation, using more cost-efficient sales channels, taking better advantage of a supplier’s bulk and early pay discounts, reducing inventory carrying costs, or shrinking the size of the product.
Weigh your options carefully, taking customer perception and competitive reactions into consideration to make sure you don’t hurt sales or brand strength.
Lowering your fixed costs lowers the bar that contribution margin needs to clear, thereby lowering your break-even point. Take a thorough look at all elements of fixed costs. Often, changes in areas such as administration, office space, back-office functions, insurance, or renegotiating credit terms are less visible to the customer as compared to variable costs that impact product quality and delivery. Outsourcing and automation are two strategies to achieve greater efficiency in typical fixed cost areas. However, it is still important to investigate the impact of making cuts that will reduce company infrastructure or increase risk.
Real-Time Metrics Tracking With Modern Accounting Software
Break-even analysis has long been a cornerstone in business plans due to its practical value as a decision- making tool. The formula is deceivingly simple, but it requires precise accumulation of cost data and sales prices. NetSuite Cloud Accounting Software does all of the heavy lifting by automating complex data tracking, so that more time can be spent evaluating the broader context of whether to launch a new product or business, rather than crunching data. NetSuite’s customizable chart of accounts organizes and captures the right level of detail, and general ledger segments can be tailored to classify information by product, profit center, program, or other factors important for your business. Together with its real-time, multidimensional general ledger with drill-down capabilities, NetSuite provides an accurate and automated foundation for analysis and strategic decision-making, including what it takes to break even.
Break-even analyses are frequently used by both new and established businesses as part of many financial management decisions. It identifies the point at which revenue equals all variable and fixed costs. For many businesses, this point represents the minimum acceptable level of activity, since making a profit and long-term sustainability require going beyond the break-even threshold. Accurate calculation and ongoing monitoring of the break-even point requires meticulous accounting so that business leaders can capture new opportunities and reduce risk.
#1 Cloud
Planning Software
Break-Even Analysis FAQs
Are there any alternatives to a break-even analysis?
Businesses can use several other financial analysis methods to evaluate profitability, make pricing decisions, and assess the viability of products or projects. They include payback period, internal rate of return, return on investment, and net present value. Each of these methods has its own strengths and are often used in conjunction with break-even analyses.
How do managers use break-even analysis?
Managers use break-even analyses to evaluate new product launches, compare current product offerings, set sales prices and revenue targets, and control costs.
What is the margin of safety in break-even analysis?
Margin of safety is the amount that actual sales exceed the break-even point, generating profit for a business. If sales are below the break-even point, there is no margin of safety, indicating that the business is not covering its fixed costs and is operating at a loss.
How can break-even analysis be helpful in evaluating risks?
A break-even analysis identifies the minimum level of activity a business must operate to avoid recording losses. For example, to assess the risk of a raw material cost increase, a business can see how many more units it would have to sell if that input cost rose by 5%, and then assess how realistic that higher unit volume would be, to consider whether it can still cover its fixed costs.