

All businesses generally must earn a profit to survive, yet how individual companies track their profits and use that information varies greatly. And tracking profit metrics in order to find places to cut costs and increase margins is as critical as ever: For the sixth quarter in a row, half or more of the small business owners and operators responding to the quarterly MetLife & U.S. Chamber of Commerce Small Business Index survey cited inflation — which, by definition, means rising costs — as their top challenge in the fourth quarter of 2023.
To analyze profit in ways that yield insights to boost performance, business managers can follow some simple formulas for converting different profitability measures into margins — ratios that look at profits as percentages of total revenue, rather than raw numbers. This article examines the common profit margin formulas, shows how to calculate them and explains how to turn the insights gained from these calculations into strategies to increase profit.
What Are Profit Margins?
Profit margins are financial metrics that capture the percentage of revenue companies retain as profit after expenses. Companies use profit margins to analyze their organizations’ efficiency and showcase their ability to generate earnings at different business stages. Financial teams, analysts and decision-makers use different profit margin analyses to find areas to reduce costs, improve efficiency and, of course, increase profitability. Lenders, other creditors (such as suppliers) and investors typically assess a business’s profit margins before deciding whether and how much to invest.
There are several types of profit margins, each measuring a different aspect of a business’s profitability. These metrics collectively act as indicators of a business’s financial health and operational efficiency. However, to prevent misdrawn conclusions and uninformed strategies, it’s essential to understand what these metrics can and can’t show about a business’s performance. By using each type of profit margin to gain insight into the operational areas it is best at evaluating, business leaders can make discoveries that steer the company toward greater operational proficiency — and higher profits.
Key Takeaways
- Profit margins provide a summary of a business’s financial health. Analyzing them is a crucial step in making better-informed decisions, especially in times of rising costs.
- Different profit margins yield insights into various operations and performance. Four commonly used profit margins are the ratios produced when gross profit, operating profit, pretax profit and net income are divided by total revenue.
- To maintain and improve profit margins, businesses should conduct regular analyses. Accounting software customarily automates much of the required data collection and reporting, speeding business managers’ time to insight.
Profit Margin Explained
Companies can calculate broad profit margins or narrower ones, depending on their needs. For example, when launching a new product line, a business can calculate the expected gross profit margin — the percentage of revenue left over when all direct costs of producing the product have been paid — to help with pricing decisions. A business looking to restructure its administrative offices to reduce overhead costs would likely examine operating profit margins, which go beyond gross profits to include rent, utilities, office salaries and other expenses.
The four main profit margins can be calculated from data reported on a company’s income statement — one of the three key financial statements, alongside the balance sheet and cash flow statement. The income statement, also called the profit and loss (P&L) statement, reports all revenue, expenses, profits and losses. The different profit measures are typically found at the bottom of their respective income statement sections, with net profit serving as the statement’s literal bottom line.
Businesses of any size can benefit from a deep analysis of profit margins when assessing their performance and/or strategic planning for the future. But they must know what to include and where to look when collecting data and making calculations. Many accountants and financial teams rely on accounting software, often as part of a larger enterprise resource planning (ERP) system, to automate data collection and generate detailed financial statements. That way, profit margins are based on accurate and up-to-date data.
Types of Profit Margins and How to Calculate Them
There are many types of profit margins, from focused rates on individual products to big-picture metrics that cover entire financial periods. But the four primary profit margins that businesses calculate and analyze are gross, operating, pretax and net. Each margin has a distinct formula and is expressed as a percentage of total revenue. This section explains all four types, including their formulas and how to calculate them, accompanied by the hypothetical example of a music shop threaded throughout to better illustrate how they can be applied.
| Type | What It Includes | Formula |
|---|---|---|
| Gross margin | Direct costs of producing products or services | Gross profit margin = [(Revenue - Cost of goods sold) / Revenue] x 100 |
| Operating margin | Above, plus indirect costs of business operations | Operating profit margin = [(Gross profit - Operating expenses) / Revenue] x 100 |
| Pretax margin | Above, plus gains, losses, revenue and expenses from nonoperating business activities | Pretax profit margin = [(Revenue - Net of all nontax expenses. gain and losses) / Revenue] x 100 |
| Net margin | Above, plux tax obligations | Net profit margin = [(Revenue - Net of all expenses, gains and losses) / Revenue] x 100 |
Gross Profit Margin
Gross profit is the amount of revenue left after subtracting the cost of goods sold (COGS). COGS comprises the direct costs associated with producing goods, such as raw materials, labor and depreciation of factory property and equipment. Therefore, the gross profit margin shows the direct profitability of a business’s goods or services by accounting for direct production costs. What constitutes a “good” gross profit margin varies from industry to industry, but most businesses improve their margins in one of two ways: by reducing costs or raising prices. The higher the gross profit, the more money the business will have for indirect expenses and other uses.
To calculate gross margin:
- Find the value of gross profit by subtracting COGS from total sales revenue.
- Divide that value by revenue.
- Multiply the result by 100 to express the margin as a percentage.
The gross profit margin formula is:
Gross profit margin = [(Revenue – COGS) / Revenue] x 100
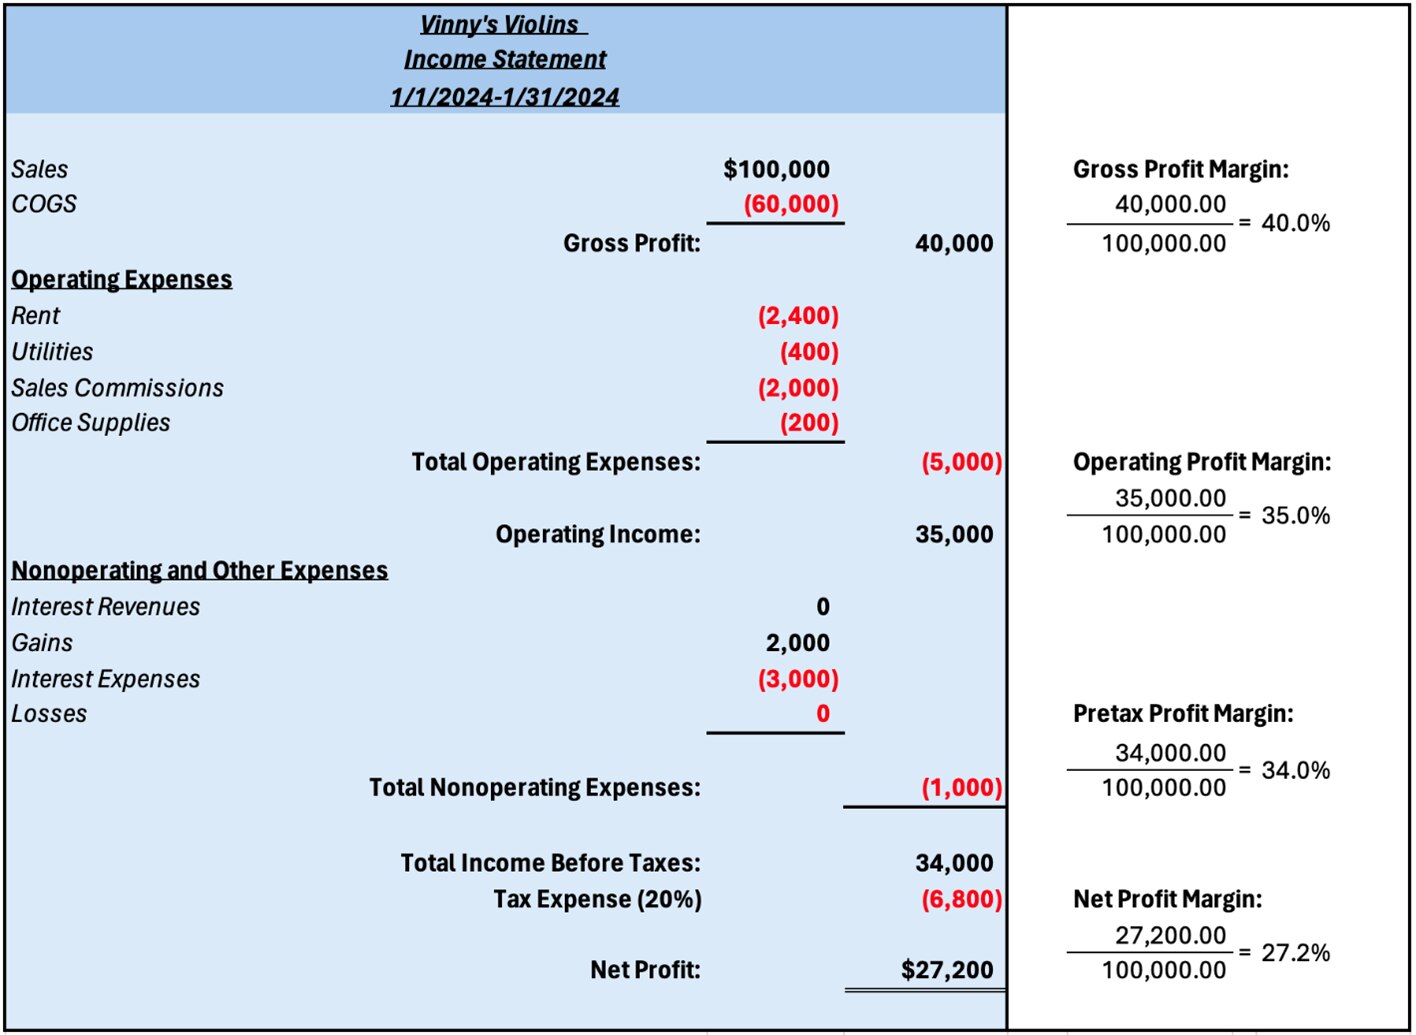
To illustrate, consider the fictional Vinny’s Violins, a music store that builds and sells instruments. Each violin costs $600 to make and sells for $1,000. In January, the store sold 100 instruments, generating $100,000 in revenue and spending $60,000 on COGS. January’s gross profit was $40,000 ($100,000 – $60,000) and the gross profit margin was 40% [($40,000 / $100,000) x 100]. That means that for every dollar earned from sales, $.60 went to direct costs and $.40 is available to pay other expenses.
Operating Profit Margin
Operating profit margin starts with gross profit and subtracts all indirect expenses and overhead costs. These operating expenses include the day-to-day costs essential for running a business, such as selling, marketing, office salaries, rent, utilities and depreciation of nonproduction equipment and property. Be careful not to double count any costs already included in COGS. By comparing operating profits with gross profits, businesses can analyze the efficiency of their nonproduct-specific expenses and look for ways to reduce them. Administrative costs are often a prime target for cost-cutting, as these expenses are typically easier to control than external costs set by raw material suppliers and equipment manufacturers.
To calculate operating profit margin:
- Find operating profit by subtracting operating expenses from gross profit.
- Divide the operating profit by revenue.
- Multiply the result by 100 to express as a percentage.
The formula for operating profit margin is:
Operating profit margin = [(Gross profit – Operating expenses) / Revenue] x 100
For January, Vinny’s Violins’ operating expenses (rent, utilities, sales commissions and office supplies) came to a total of $5,000. That left an operating profit of $35,000 ($40,000 – $5,000). By dividing that by revenue, the music store calculates an operating profit margin of 35% [($35,000 / $100,000) x 100]. Therefore, for every sales dollar, $.65 went toward core business operations and $.35 was left for other uses.
It’s worth noting here the relationship between operating profit and EBITDA (earnings before interest, taxes, depreciation and amortization), another important profitability measure. EBITDA is commonly calculated as operating profit plus depreciation and amortization, two costs that, like interest and taxes, are influenced by accounting decisions. The EBITDA calculation removes these potentially distorting expenses to provide a clearer view of the financial health of a business’s operations.
Pretax Profit Margin
Sometimes called earnings before tax, or EBT, the pretax profit margin adds in gains and subtracts expenses from other business activities, such as interest earned on investments (gain) or paid on loans (expense), and any other ancillary gains and losses that occurred during the financial period. Pretax profit margin is commonly used to compare the performance of different businesses as it is more comprehensive than gross and operating profit margins, but does not include tax obligations, which can vary with the type of business or industry.
To calculate pretax profit margin:
-
Find the pretax profit by summing all gains, expenses and losses, except for taxes, and subtracting the result from revenue.
-
Divide the pretax profit by revenue.
-
Multiply the result by 100 to convert it to a percentage.
The pretax margin formula is:
Pretax profit margin = [(Revenue – Net of all nontax expenses, gains and losses) / Revenue] x 100
During January, Vinny’s Violins made an interest payment of $3,000 on an existing loan. But the store also earned $2,000 from an investment, for a net expense of $1,000. By adding this expense to those included in the gross and operating profit calculations, the music store has an EBT of $34,000 and a pretax profit margin of 34% [($34,000 / $100,000) x 100].
Net Profit Margin
This is the final count of a business’s profitability — it’s the bottom line of the income statement, after all. Net profit considers all expenses and obligations, including taxes, to reveal what percentage of revenue is actually usable profit at the end of a financial period. This margin is the ultimate indicator of a company’s financial health and efficiency and is often used as the starting point for assessing success.
To calculate net profit margin:
-
Find net income by summing all gains, expenses and losses, including for taxes, and subtracting the result from revenue.
-
Divide net income by revenue.
-
Multiply the result by 100 to express the margin as a percentage.
The formula is:
Net profit margin = [(Revenue – Net of all expenses, gains and losses) / Revenue] x 100
At this stage, all Vinny’s Violins has to do is add its tax obligation to all its other expenses to determine its net income. Its accountants estimate that the store owes $6,800 in taxes for January. Subtracting that tax from pretax profit leaves net income of $27,200 ($34,000 – $6,800) and a net profit margin of 27.2% [($27,200 / $100,000) x 100]. For every dollar Vinny’s earned in sales, around 27 cents was left over for reinvestment or other purposes.
Profit Margin Calculator
While all the profit margin formulas discussed above use the same core concept — subtracting expenses from revenue — manually calculating multiple profit margins repeatedly can be cumbersome. Even simple spreadsheets can automate many of these calculations, as shown in our downloadable profit margin calculator(opens in a new tab) template with embedded formulas. The calculator download is an Excel file modeled after the hypothetical income statement shown above, so that business managers can insert their own numbers to see all four margins calculated.
However, as a business grows and its finances become more complex, it will likely need a more scalable solution for tracking financial performance. Many companies use accounting software or more sophisticated approaches, such as ERP systems, that leverage automation to collect operational data and generate financial statements and reports. Such technology is quicker and more accurate than manual calculations, and it typically leads to more robust data, which, in turn, yields better analyses of business profitability.
How to Use Profit Margin
Profit margins provide insights into where potential performance improvements may be made throughout an organization. Business leaders can use such knowledge to make more-informed decisions, optimize pricing strategies and strengthen internal controls. For example, a higher net profit margin than is common in your industry might suggest that it’s time to invest more in the company and expand operations. On the other hand, a narrow gross profit margin may signal that the company should make internal adjustments to its production processes or raise prices to increase revenue.
How frequently a business analyzes its profit margins depends on the volatility of the industry and market conditions. Many businesses generate monthly or quarterly financial reviews, with less frequent, but regular, periods of deeper analysis. Others, especially those that sell low-margin goods or participate in rapidly changing industries, might benefit from more regular analysis, such as weekly check-ins. Regardless of how often these check-ins occur, regular review can act as an early warning system, helping businesses respond to market challenges sooner.
Beyond internal process analysis, companies can use profit margins to compare their efficiency with competitors and inform future goals and forecasts. This helps company analysts create a more realistic and big-picture view of strengths and weaknesses by contextualizing performance within the larger business landscape. It’s important to remember that while profit margins often reflect past financial performance, business leaders can use them to shape future strategies — both for targeted efficiency improvements and long-term goals.
Example of Profit Margin
To demonstrate effective use of profit margin analysis, consider a hypothetical retail clothing store chain that is experiencing a profitability plateau that is delaying plans to open a new location. The chain’s senior management team decides to conduct a comprehensive profit margin analysis to identify areas for improvement, focusing on four key metrics: gross, operational, pretax and net profit margins.
First, business managers calculate the gross profit margin by subtracting the direct costs of purchasing clothing and accessories from sales. Even though they find that the gross profit margin is comparable to industry standards, they believe there’s room for improvement. Managers reach out to suppliers to renegotiate terms and refocus inventory on higher-margin items, leading to increased profit without the need for larger inventory reserves or higher-volume sales.
Next, they look at operating profit margin by subtracting operating expenses from the gross profit, including employee wages, store rent and utilities. Through this analysis, they discover that excessive overhead costs are cutting into profitability. However, staffing costs are as lean as they can be without overworking employees or harming customer service, so the team looks for nonlabor costs to reduce, specifically utility costs. To minimize energy consumption, the managers purchase more efficient lighting and computers, trading short-term investments for long-term savings.
Then, the team subtracts all other nontax expenses to calculate the pretax profit margin, which unexpectedly shows a large drop. Upon further analysis, the team realizes that one of the store’s older business loans has a higher-than-average interest rate and is significantly impacting profits at this stage. By refinancing this debt to a lower rate, the business can reduce its interest payments and minimize the drop from operational to pretax profit.
Finally, the management team subtracts the tax obligation and finishes the income statement’s bottom line, net profit. Every improvement, from small to large, made during this analysis increased the net profit, leaving more money to reinvest in expansion. Additionally, this once “comparable to industry standard” business is now leading the pack and is better suited to meet customer demand than its competition. But even with these achievements, the management team commits to reevaluating these margins every quarter to proactively fix any inefficiencies that arise and maintain their competitive advantages.
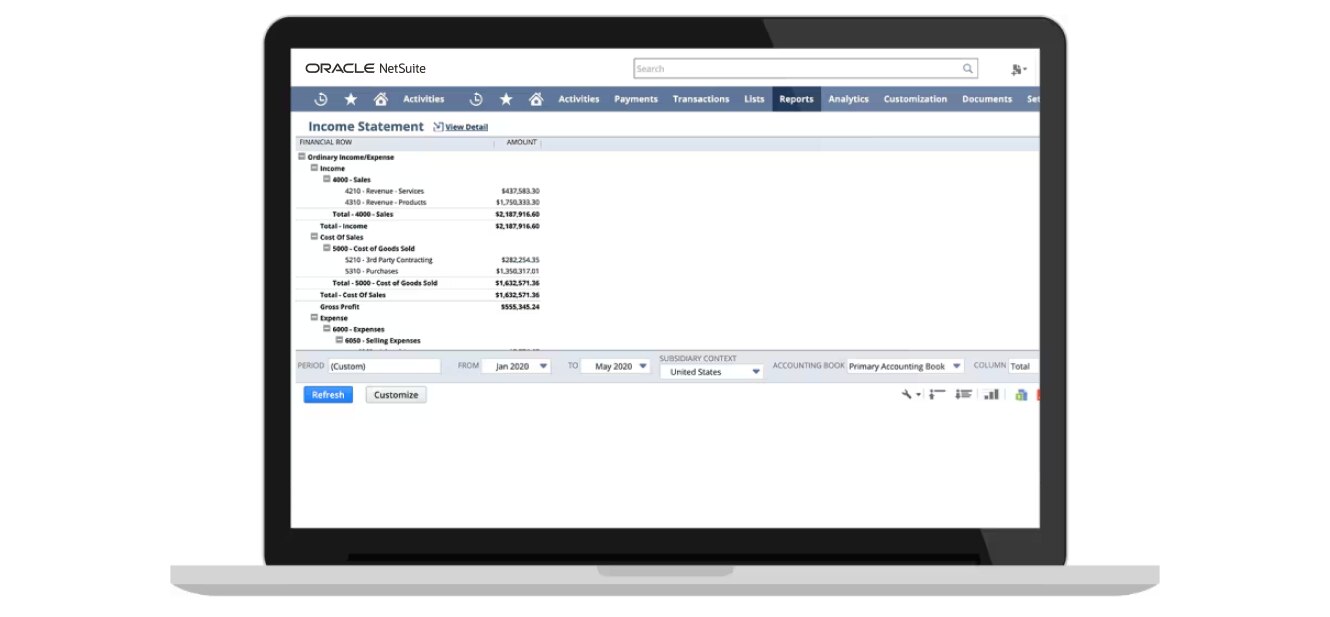
Replace Spreadsheets and Boost Accuracy With NetSuite
Maintaining margins in the face of rising prices, volatile demand and increased competition can be challenging for any business. With NetSuite Financial Management, businesses can streamline their financial processes and gain real-time insights into performance rather than spending weeks collecting and organizing data that is out of date before it can be analyzed. With features designed to accelerate financial closes and report with accuracy, NetSuite empowers businesses to calculate margins and assess profitability with confidence.
NetSuite’s comprehensive and secure cloud-based solution is tailored to drive business strategy and growth, wherever and however authorized users choose to access it. With intuitive and customizable dashboards and reporting capabilities, NetSuite enables businesses to produce budgets, forecasts and what-if scenarios quickly and accurately. NetSuite’s data-driven solution ensures that financial strategies are aligned with broader business objectives, from focused margin improvements to organizationwide overhauls.
To overcome economic shifts and rising costs, it is critical for businesses to understand the nuances of profit margins. By calculating gross, operating, pretax and net profit margins, business leaders gain visibility into operations and can develop targeted strategies for eliminating inefficiencies and maximizing profits. And through regular analysis of these margins, companies can repeat successes and proactively address weaknesses, strengthening overall performance and building long-term strength.
#1 Cloud
Accounting
Software
Profit Margin FAQs
What is a good profit margin?
A good profit margin varies by industry, so businesses should conduct market research when comparing their performance with competitors. In general, gross profit margins should be high enough to cover indirect costs and other obligations while retaining enough revenue to reinvest and provide a buffer against market fluctuations. To illustrate how they might differ, consider that manufacturing companies often have gross margins between 20% and 40%, while marketing agencies — which have lower direct costs — can expect margins to range from around 40% to 70%.
How do I calculate profit margin?
Depending on the type of profit margin, it is calculated by subtracting relevant expenses from revenue, then dividing the result by revenue. Then, multiply by 100 to convert the figure into a percentage. For example, when calculating net profit margins, you subtract from revenue all expenses and losses and add in any gains from ancillary business activities. But when calculating gross profit margins, you subtract only the direct costs of producing a product or service.
What is the difference between profit and margin?
Profit is the difference between revenue and expenses in dollars, while margins express profit as a percentage of revenue, providing a ratio of profitability relative to sales. This percentage normalizes direct comparison and trend analysis for a more contextualized view of performance.
Is a profit margin of 20% good?
Generally, a 20% profit margin is considered good, but “good” benchmarks vary by industry. When determining a business’s financial strength over a given period, additional context should be added, such as industry averages, competitor performance and historical trends.
What is a 30% profit margin?
A 30% profit margin means that for every dollar of revenue earned, a company keeps $0.30 as profit after all relevant expenses have been paid. This $0.30 can then be reinvested into the company or paid out to stakeholders.
Is 7% a good profit margin?
For many industries, a 7% profit margin may be considered low. However, for some companies, such as high-volume, low-margin industries like grocery stores, a lower profit margin is expected and can signify a healthy and successful operation.


