
Cost of goods manufactured (COGM) answers a fundamental question in manufacturing: What does it really cost to produce finished goods? This metric tracks expenses from the moment raw materials enter production until finished goods leave the factory floor. For business leaders seeking to optimize manufacturing operations and increase profitability, COGM serves as both a performance metric and a decision-making tool. The following discussion takes a deep dive into the components, calculations, and challenges of this specialized metric—and its close cousin, cost of goods sold.
What Is Cost of Goods Manufactured (COGM)?
COGM represents the total production costs for goods completed during a specific accounting period. It includes direct materials used in production, direct labor costs for workers who make the products, manufacturing overhead expenses, such as factory rent and utilities, and the similar costs that may have been incurred in prior periods but are associated with the goods completed in the current period. COGM is used to value finished goods inventory on the balance sheet by factoring in the current period’s manufacturing costs and the net change in work-in-process (WIP) inventory. COGM excludes non-manufacturing costs, such as selling, general, and administrative expenses, and marketing costs, since they are not directly related to production.
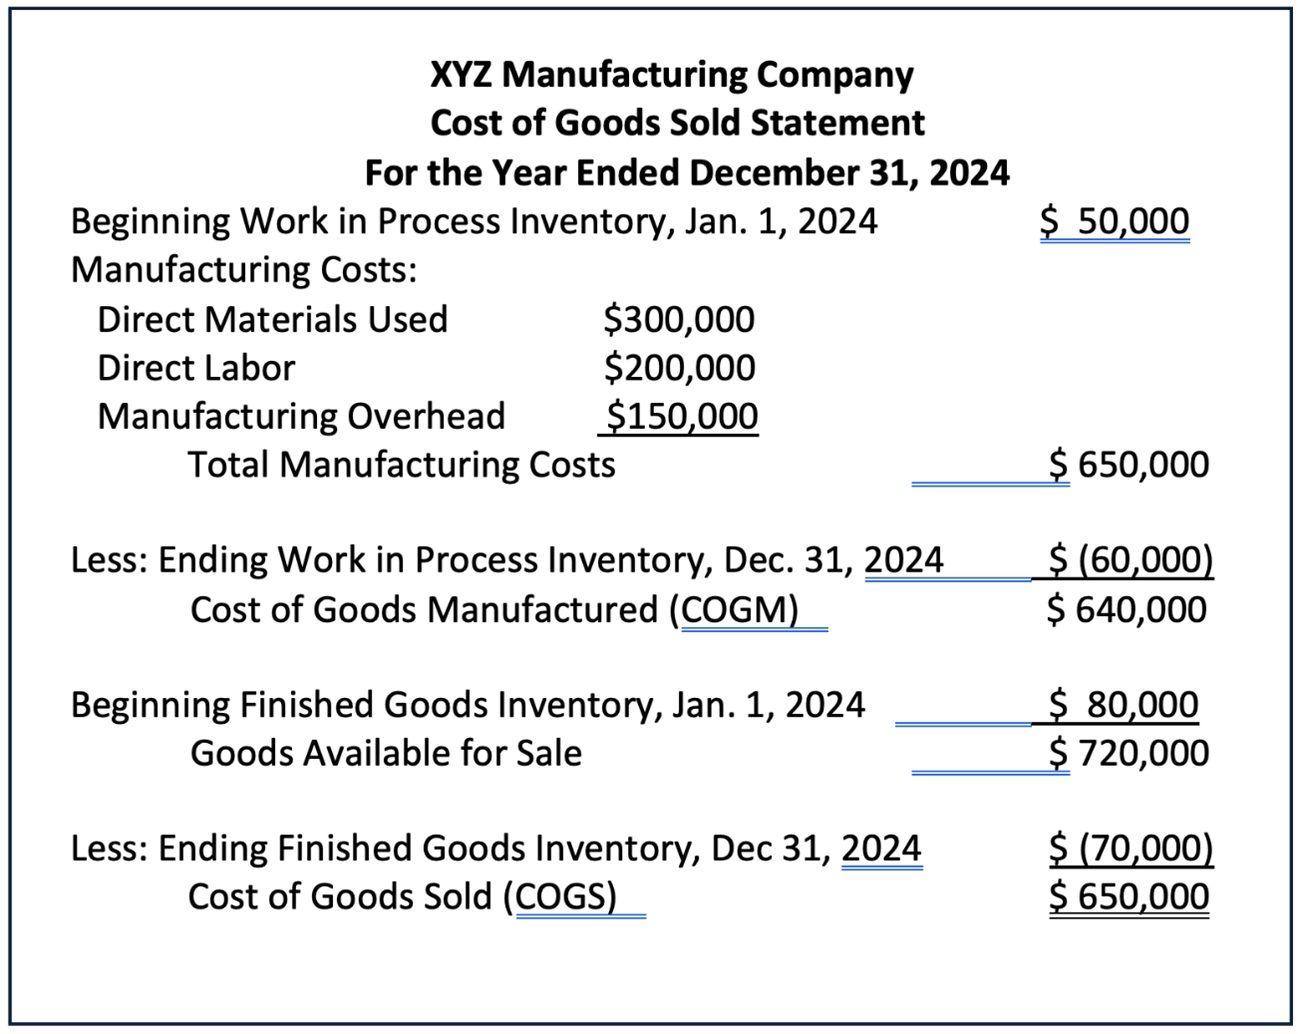
Manufacturing companies customarily document COGM in a schedule of cost of goods manufactured, often called a COGM statement. This financial report details changes in product costs for a particular accounting period, including the opening balance, purchases, and ending balance of raw materials, changes in WIP inventory, and manufacturing overhead expenses. Though the COGM statement is primarily prepared for internal purposes, as a way to help business leaders track and analyze manufacturing costs and efficiency, auditors and tax authorities may examine it, too, as part of their review of cost of goods sold (more on this later).
Key Takeaways
- COGM measures the full cost of manufacturing finished products during an accounting period.
- It is used by manufacturers to control costs, manage inventory, evaluate performance, set prices, and create accurate financial reporting.
- Calculating COGM is a multistep process that interprets both the cost of works in process and total manufacturing costs (TMC) in order to ascertain the cost of completed goods.
- The progression from TMC to COGM to cost of goods sold (COGS) helps managers track efficiency, monitor product completions, and match costs with revenue.
- Integrated financial management solutions help manufacturers overcome common COGM challenges, primarily through automation and standardization.
Cost of Goods Manufactured Explained
COGM follows the flow of manufacturing costs through three distinct production stages: raw materials, WIP, and finished goods. It captures how costs accumulate and “transition” as products move toward completion, beginning with the requisitioning of raw material inventory. The first major cost transition occurs when the costs of these input materials, which might have been purchased at different times and prices, are carried into production using the company’s inventory valuation method. If the company uses the weighted average costs method, for example, it would yield a slightly different value than the first in, first out method. That first cost transfer marks the shift from raw materials inventory to WIP inventory.
Once the raw materials are in production, two additional cost elements are incurred and added. Direct labor costs accumulate as workers transform the raw materials into finished products. At the same time, manufacturing overhead costs—including factory utilities, equipment depreciation, and indirect materials, such as lubricants or small tools—are allocated to the products being manufactured. All of these costs are collected in WIP inventory as products continue to move through the various stages of completion. This phase represents the most dynamic stage of cost transformation, as multiple cost components converge.
When the product is fully manufactured and ready for sale, all accumulated costs—raw materials, direct labor, and manufacturing overhead—are transferred from WIP inventory to finished goods inventory. This transfer of completed product costs represents the COGM. These manufacturing costs remain attached to the products in finished goods inventory until they are sold. When a finished product is purchased by a customer, its cost moves from finished goods inventory to COGS, and it is recognized as an expense on the company’s income statement.
In this way, COGM provides a comprehensive view of a company’s manufacturing expenses and is essential for accurate cost monitoring.
Why Is Cost of Goods Manufactured Important?
COGM plays a vital role both in day-to-day manufacturing operations and in financial reporting. It also contributes to strategic decisions regarding product life cycle management and supply chain management. Five key areas highlight COGM’s fundamental importance to manufacturing businesses.
- Cost control: COGM helps manufacturers identify which production costs are rising or falling over time by tracking materials, labor, and overhead separately. This level of detail allows managers to spot operational inefficiencies, such as rising overhead costs, as well as supply chain issues, such as excessive material waste. COGM helps managers pinpoint problem areas so they can take targeted actions to reduce costs and improve profitability.
- Inventory control: CalculatingCOGM requires precise measurement of raw materials, WIP, and finished goods inventory levels throughout the production cycle. As a result, manufacturers use COGM as a tool to optimize the supply chain and maintain efficient inventory levels, which helps prevent both stockouts and excess inventory. Regular COGM analysis reveals whether production rates align with sales forecasts and inventory goals.
- Performance evaluation: Analyzing variances between actual COGM and budgeted or standard costs is a primary way for managers to assess production efficiency and set goals for improvement. COGM trending shows whether cost-reduction initiatives are succeeding and highlights areas that need extra attention or investment. Thus, COGM serves as a key performance indicator for production managers and their departments.
- Pricing: Understanding the full cost of manufacturing through COGM furnishes companies with the information they need to set appropriate product prices that support profitability. COGM provides a baseline for setting sales price markups that will also cover nonmanufacturing costs and achieve the organization’s desired profit margins. Analyzing COGM by product helps companies maintain competitiveness and sustain profitability.
- Financial reporting and planning: COGM is essential for accurate financial statements and financial planning. It contributes to calculating a manufacturing company’s COGS, which is reported on the income statement, and to valuing inventory, which is listed on the balance sheet. Additionally, historical COGM cost data is used in analytics to help project future production costs more accurately and to set realistic business goals when creating budgets.
Cost of Goods Manufactured Formula
Manufacturers calculate COGM using this basic formula:
COGM = (Beginning WIP inventory + Total manufacturing costs) – Ending WIP inventory
where:
Total manufacturing costs (TMC) = Direct materials + Direct labor + Manufacturing overhead
How to Calculate COGM
COGM must capture all costs associated with goods finished during the current period, regardless of when the work began. This is no easy task. Calculating COGM requires careful tracking of all production costs, including work carried over from accounting during previous periods. Historically, manufacturing companies gathered this data from production reports, labor time cards, material requisition forms, and overhead allocation spreadsheets. Today, the information needed to calculate COGM is more readily available, especially in companies that use integrated enterprise resource planning (ERP) systems that automatically collect and report data from various production activities and accounting subsystems.
Regardless of how the data is collected, calculating COGM follows the three-step process described below, which is necessary to determine the proper attribution of manufacturing costs to finished products.
1. Calculate Work-in-Process (WIP) Inventory
WIP inventory is the logical starting point for COGM calculations because manufacturing is a continuing process that spans multiple accounting periods. The quantity and volume of WIP at the beginning of an accounting period represents partially completed goods that were started in the previous period but will be finished in the current period.
Conversely, ending WIP captures the cost of products still in production when the period ends. Since these are unfinished, they are subtracted from COGM for the period. As such, valuing ending WIP is an important part of the process. For companies that use the periodic inventory approach, in which the quantity and value of inventory is determined at specific intervals—usually the end of an accounting period—this valuation usually entails physical counts and assessment of each item’s stage of completion. Accountants then apply standard costs or percentage of completion methods to determine the value of these incomplete units. Businesses that use automated perpetual inventory systems can value their ending WIP using actual, real-time data. Keep in mind that the ending WIP inventory value impacts both the current period’s COGM and the next period’s, because it becomes the latter period’s beginning WIP inventory.
2. Calculate Total Manufacturing Costs (TMC)
TMC combines the three fundamental product costs: direct materials, direct labor, and manufacturing overhead. The value of direct materials in TMC includes only the raw materials and parts consumed during the period to produce finished goods. The calculation for direct materials used in production is:
Direct materials used = (Beginning raw materials + Purchases) – Ending raw materials
Direct labor represents wages for employees who directly worked to convert raw materials into finished goods; the amount added to TMC is usually taken from company payroll records.
Determining the amount of manufacturing overhead to include in TMC can be complicated, since it encompasses costs from a variety of other production areas, such as factory utilities, indirect materials, supervisory salaries, and equipment depreciation. These costs must be carefully accumulated and allocated using one of several allocation methods, such as activity-based costing, the step-down method, or reciprocal allocation, then added to TMC.
3. Calculate Finished Goods Inventory
The final step is to complete the COGM formula by combining beginning WIP inventory and total manufacturing costs, then subtracting ending WIP inventory. The resulting COGM represents the total cost of products that moved through production to finished goods inventory during the fiscal period. When combined with the finished goods inventory shown at the beginning of the period, it demonstrates the total inventory that was available for sale, which is a key component of COGS.
COGM Calculation Example
Let’s walk through a practical example of how a manufacturer calculates COGM using the formula and steps outlined above. Consider AlbertaBev, a hypothetical sparkling beverage manufacturer known for natural, fruit-infused drinks. AlbertaBev must calculate its COGM for February 2025. During the month, it began producing its spring beverage lineup, including its bestselling orange and blueberry sodas. Assume the following production costs and inventory values:
- Beginning WIP inventory on Feb. 1, 2025: $50,000
- Direct materials used during February: $200,000 (includes organic fruit concentrates, natural sweeteners, purified water, carbonating ingredients, glass bottles, and labeling materials)
- Direct labor for February: $150,000 (includes mixers, carbonation production-line workers, and bottling line operators)
- Manufacturing overhead: $100,000 (includes utilities for refrigeration and sterilization, equipment maintenance and depreciation, and insurance costs for the factory)
- Ending WIP inventory on Feb. 28, 2025: $60,000
Step 1: Identify Beginning and Ending WIP Inventory
AlbertaBev’s WIP inventory at the beginning of February was $50,000. This represents partially completed beverages carried over from January, including both the value of ingredients placed into production and estimates of the labor and overhead costs already invested in these batches, which will be the first beverages completed during February.
On Feb. 28, 2025, AlbertaBev determines that its ending WIP inventory is $60,000. To make this determination, AlbertaBev relied on data from automated production reports that measure volume in mixing tanks and partially completed bottling runs, along with allocations of labor and overhead from its ERP system. Since these products are incomplete, their associated costs will be removed from February’s COGM and will become March’s beginning WIP inventory value.
Step 2: Calculate Total Manufacturing Costs
AlbertaBev’s ERP system accumulates all manufacturing costs incurred during February from initial mixing of ingredients to final packaging. It tracks direct materials as they are picked from raw materials inventory and employed in production. Labor hours are automatically recorded through production line scanning systems, with actual payroll rates flowing directly from the human resources (HR)/payroll module. Overhead costs are captured in real time by integrated systems, such as utility meters and equipment monitoring systems, with actual costs flowing from the accounts payable module. With this data in hand, TMC is calculated as follows:
TMC = Direct materials + Direct labor + Manufacturing overhead
TMC = $200,000 + $150,000 + $100,000
TMC = $450,000
Step 3: Calculate COGM
AlbertaBev accountants plug the values found in the first two steps into the COGM equation:
COGM = (Beginning WIP + TMC) – Ending WIP
COGM = ($50,000 + $450,000) – $60,000
COGM = $440,000
AlbertaBev’s COGM of $440,000 represents the total cost of beverages that were fully completed during February and transferred to finished goods inventory, ready for distribution to retailers.
Common COGM Challenges
As the AlbertaBev example illustrates, calculating COGM is rarely a simple task for manufacturers. A variety of factors, both internal and external, can create challenges that make accurate cost calculations difficult. What’s more, businesses often calculate multiple versions of COGM—by product, division, factory, and overall. Understanding the most common challenges—and knowing how to address them—is crucial for ensuring that COGM accurately reflects true production costs and can, therefore, lay the groundwork for sound business decisions.
- Inventory management: Manufacturing companies must accurately track and manage each type of inventory—raw materials, WIP, and finished goods—across multiple locations and production stages to properly calculate COGM. Accurate WIP inventory valuation can be difficult, and any errors would distort COGM. Poor inventory management for raw materials, such as in a stockout, can bring production to a halt and create extra costs later, as the production line tries to catch up. Excess finished goods inventory often leads to increased inventory shrinkage, making COGM appear artificially high. To address these challenges, manufacturers use integrated ERP systems that provide real-time visibility and automate inventory management across all production stages.
- COGM accuracy: Calculating COGM accurately presents several interconnected challenges. They begin with ensuring accurate data, which requires proper classification of all costs, the unraveling of mixed costs, and careful allocation of expenses within complex, shared manufacturing processes. Additional complications arise from real-world operating factors, such as selecting appropriate allocation bases for overhead and labor complexities, such as downtime or multitasking workers, all of which must be applied consistently across periods. Automated cost accounting systems can help refine these processes and improve accuracy.
- Seasonal or external changes: Seasonal and external factors challenge accurate calculation of COGM because they impact production volumes and cost structures. Seasonal demand spikes can drive up labor and overhead costs, while off-peak periods can result in underutilized capacity and higher per-unit fixed costs. External disruptions, such as supply chain bottlenecks or fluctuating material prices, further complicate cost calculations. To reliably maintain accuracy, businesses should regularly review and adjust their cost assumptions, allocation methods, and inventory valuation techniques.
Cost of Goods Manufactured (COGM) vs. Cost of Goods Sold (COGS)
COGM and COGS are different, but related concepts that answer two separate questions:
- COGM: What did it cost us to make the products we completed this period?
- COGS: What was the cost of the products we actually sold this period?
Thus, COGM represents the total cost of goods completed during an accounting period. When company accountants add COGM to the finished goods inventory from the beginning of the period, they can see all the stock the company has available to sell. COGS is the cost for only those products that are actually sold to customers during the accounting period. The key differences between COGM and COGS lie in timing and inventory. COGM is the cost of goods completed and put into inventory, whereas COGS recognizes costs only once products are sold, thus matching a product’s expense to the revenue it earned.
It’s also worth noting that while the basic COGS formula for all companies (COGS = Beginning inventory + Purchases – Ending inventory) does not reference COGM, manufacturing companies customarily use this formula: COGS = Beginning finished goods inventory + COGM – Ending finished goods inventory.
Cost of Goods Manufactured (COGM) vs. Total Manufacturing Costs (TMC)
Just as COGM is part of manufacturers’ COGS calculation, TMC is a part of the COGM formula. TMC represents all manufacturing costs incurred during a specified period—direct materials, direct labor, and manufacturing overhead. It is a core part of the COGM formula, but not the entire formula.
To visualize the relationships among TMC, COGM, and COGS, imagine a flow of costs moving through the production and sales process.
-
TMC: All manufacturing costs incurred in a period
↓ -
COGM: Takes TMC and adjusts for changes in WIP inventory to show the cost of goods that were finished during the period
↓ - COGS: Takes COGM and adjusts for changes in finished goods inventory to show only the costs of goods that were actually sold in the period
Understanding these relationships helps managers improve their ability to track all three components: production efficiency (TMC), completion of goods (COGM), and the matching of costs to revenue (COGS).
An All-in-One Accounting Solution for Manufacturers
NetSuite’s cloud accounting software automates and simplifies the complex accounting processes involved in tracking manufacturing costs and calculating COGM. NetSuite provides easy access and real-time visibility into manufacturing costs, and its built-in financial reporting tools can generate COGM statements at various levels of granularity. It also can automatically produce related cost allocation reports and variance analyses, and maintain detailed audit trails that can help ensure regulatory compliance.
NetSuite ERP can scale with manufacturers as their businesses grow, without sacrificing accuracy or control. Companies can standardize their cost accounting processes while maintaining sufficient flexibility to adapt to changing business needs. And because NetSuite accounting software seamlessly integrates cost data from production, inventory, HR, procurement, and supply chain modules, it eliminates the time and effort needed to transfer data from multiple, disparate subsystems and reduces the potential for errors in COGM calculations.
Accurate COGM calculations provide manufacturers with crucial insights into their production costs and efficiency. By tracking and analyzing the flow of costs through the production cycle—from raw materials to WIP to finished goods—companies have better information with which to set competitive prices, optimize resources, and improve efficiency. Though calculating COGM can become tricky, particularly in complex manufacturing environments, automated accounting systems help businesses maintain accuracy and consistency in their cost accounting practices.
#1 Cloud
Accounting Software
Cost of Goods Manufactured FAQs
What is the per unit cost of goods manufactured (COGM)?
Per unit COGM is calculated by dividing total COGM by the number of units completed during a particular time period. This metric includes all the costs related to direct materials, direct labor, and manufacturing overhead, and is adjusted for changes in work-in-process inventory. Analyzing COGM on a per-unit basis is useful for comparing costs across periods of varying production volumes.
What is included in the cost of goods manufactured (COGM)?
COGM includes three main cost categories: direct materials consumed in production, direct labor for manufacturing workers, and manufacturing overhead, such as factory utilities and equipment depreciation. These costs are adjusted for changes in work-in-process inventory to reflect only the costs of finished goods.
Is cost of production and cost of goods manufactured (COGM) the same?
No, cost of production, also called total manufacturing costs, represents all manufacturing costs incurred during a given period, regardless of the product’s completion status. Total manufacturing costs are one part of the COGM formula. COGM goes a step further and adjusts these production costs by adding beginning WIP inventory and subtracting ending WIP inventory to show only the cost of goods that were actually completed during the period.
How do you find the beginning WIP?
Beginning work-in-process inventory can be found as the ending WIP value from the previous period. Enterprise resource planning systems automatically carry this value forward, tracking both the physical quantities in production and their associated costs.